
Here we are rapidly moving through time. History-making is ongoing. Global impacts. The ongoing impact of a global disease outbreak. Weather. Unrest. War. Sound like a science fiction disaster movie? Nope. It is our reality. What is happening now, and where? Always the main questions that are asked.
Tell us about three things that happened this week that were not location based. Or, maybe a better question is what happened this week where location was NOT important?
The combination of location and everything about that location is certainly powerful. When we want to dig deeper we often seek a map view. The effective “map visualization” affords us a starting point to begin to understand more. Think about what has happened in the past 24 hours. Maps showing “where” can give us a lot of context.


We read the news as soon as we are up each day. Not just one news outlet, but news from main news outlets in our countries of interest and several from the USA. Consistency of reporting is what we seek. We look for the sources referenced and go to them to learn more.
- Research related news? We go to the published source or one of the preprint sources (for those papers undergoing “peer review”). There is so much rapidly emerging research today it makes our heads swim. We depend on sources to have governance in place.
- A new SARS-COV-2 variant? Where is it emerging? Need a map. Trusted sources? Check for articles in multiple outlets for their sources. Consistency. It’s what we use to validate our information.
- A war breaks out. Where? When? We do not want opinions about this, but the running reporting from close by if possible. With maps that change as the situation changes giving us visualization of where and what. Oh, and videos are helpful, too.
- Crazy weather? Daily, it is happening across the world. We want to be prepared. We want to know more. Where and when will it impact us, if it will?
Always the question. Is the location data (information) trustworthy?
How do we validate a location’s integrity? What is our criteria?
This can change, but remember – Consistency is crucial. Information may be single-source or multi-sourced – but similar, wherever you find it. Go back to the paragraph where I said, that we check multiple news outlets for consistency.
There might be other criteria that we impose when validating information for quality. Criteria may change depending on the type of information. A latitude, longitude and coordinate reference system for a location may not change substantially depending on what the location represents. Facts about the location, however, may change all the time.
There is such a thing as information that does not change, or changes infrequently. Another criteria might be currency – how old is the information? Depending on the subject matter, old can be yesterday or old can be years ago. What is at that location now vs. ten years ago? This matters.

Is it the truth? Is this the true location? What does this mean? You can’t have location intelligence if your location is wrong.
Take it up a level. Here is another question to think about. Do we always accept what we find on a map or what we read at face value? We shouldn’t. But some people do. But, then there’s an “oopsie”. What happens then? Reliability and veracity go down the drain. Once trust is lost, it is not easy to regain it.
For data collection for use in maps, remember that the location data needs to be “good enough” or better for the use-case. For high-precision mapping, the location resolution required may be centimeters – for just getting something in the area, meters or more can be okay. Ground-truthing may be required to validate locations used in high-precision mapping. Safety first.
Let’s walk back in time to understand at a high level, the mechanics of mapping.
Back in the day, people used versions of hand-drawn masters of maps on paper. The paper was usually a specialized type, designed for endurance due to multiple changes over time. The master maps were the “spatial database” and the “visualization” all in one. Difficult to update, and arduous to validate.
Locations of places on these maps were sourced from surveyor plats, reports from engineers on any re-measurements or changes from the survey plats, and such. There was a process used for adding each location – all were carefully measured using an engineering ruler and specialized drafting tools.
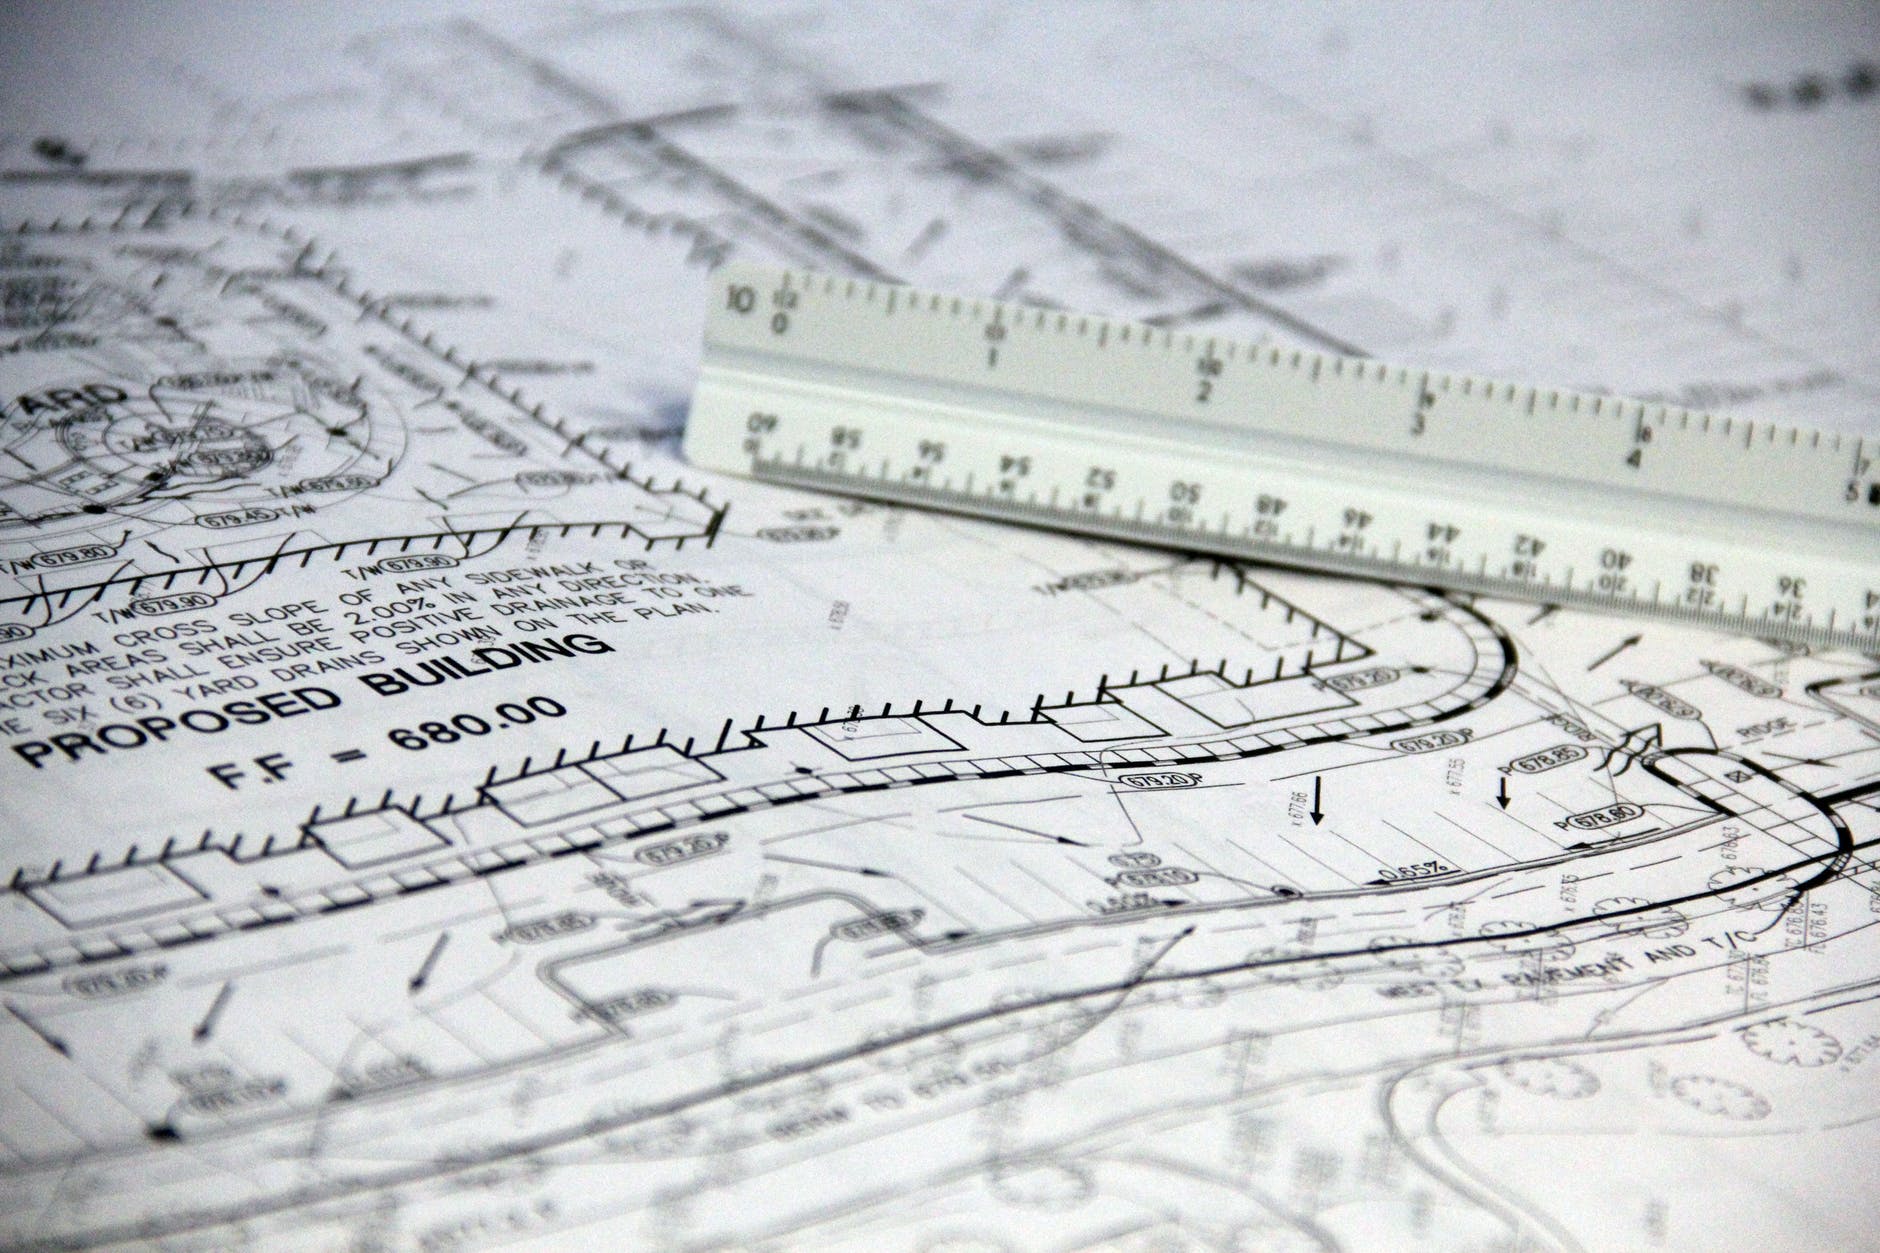
To revise a map required another version of the map. These were stored flat in large drawers. When people needed maps, a copy was made on a large flat bed, very expensive blue line machine. I remember watching these guys work. It was a fascinating process.

Today, we use computers and databases – even in the field, hand-held mobile GPS units frequently replace the old instruments as additional “field data collection” tools. CAD is used, as well as a GIS, with mapping tools to transform the field collected information into databases and visualizations (maps).
3D capabilities now exist, using terrain modeling with remote sensing data..


We can visualize the earth using a globe-style or a flat map style, all dependent on the underlying data. The visualization may look correct, but do we really know if we can trust the data? There is a lot of dependency on people who have worked on the data throughout its life cycle. Trust is built over time. Data must be validated.


